Full-Stack Engineer · AI & Automation

I build systems that save real money.

I work across React/Next.js, Python, and .NET — and ship the hard parts: data pipelines, cloud, and real UX.

reclaimed
$41K/yrreclaimed~733 hrs/yr of manual work automated at an engineering firm
production apps
10+production appsused daily by 30+ people
projects indexed
7,113projects indexedsub-second search across the firm archive
React.NETPythonNode.jsSQLAgentic AI
Résumé

Flagship · production ecosystem

The software platform behind a 50-person engineering firm

I grew a fragile internal toolset into 5+ production apps used daily by 30+ people, reclaiming ~1,000+ engineering hours a year.

$0K/yr
reclaimed
~733 hrs of manual work automated
0%
effort cut
forecasting vs the old Excel process
0+
production apps
used daily by 30+ people
financial-analysis & trading bots
also built
across finance, AI & industrial automation
01

Access → SQL → WPF / .NET 9 modernization

Migrated a legacy Access database (12 tables, no referential integrity) to a normalized SQL Server schema and rebuilt it as a WPF / .NET 9 app on Clean Architecture + EF Core — reclaiming ~733 hrs/yr (~$41K) for 30+ daily users, synced to the Ajera ERP via ODBC.

  • .NET 9
  • WPF
  • EF Core
  • SQL Server
  • Clean Architecture
02

Workforce-capacity forecasting platform

A Python / FastAPI + Next.js platform fusing the Ajera ERP (ODBC) and Vantagepoint CRM (REST / OAuth2) into 3 forecast models and a 12-month KPI dashboard — ~90% effort reduction versus the manual Excel process it replaced.

  • Python
  • FastAPI
  • Next.js
  • OAuth2
  • Power BI
03

MCP / AI-assisted dev stack

A 4-server MCP stack for AI-assisted development (Claude Code + CLAUDE.md enforcement), the firm’s Revit add-in suite architected across 4 versions, and 7 authored SOP/standards docs.

  • Claude Code
  • MCP
  • Revit API
  • CI/CD
Also shipped at the firm
  • OCR doc-intelligence over 10,000+ files
  • 7,113-project search · sub-second
  • Company site — Next.js 15 / React 19 / Three.js / Supabase
  • Revit add-in suite · 4 versions (2023–2026)
  • 35+ zero-downtime releases

Signature project · agentic systems

jarvis — an agentic loop that hears, reasons, and acts

waking…
  1. Acquire“Hey Jarvis”
  2. UnderstandWhisper
  3. ReasonLLM
  4. DeliverStreaming TTS

Auto-playing the loop — the orb’s state lights the matching stage. Tap “Act” to see the tools.

The same loop, in production at Motz

  1. AcquireAjera ODBC + Vantagepoint REST
  2. PipelineAccess → SQL Server
  3. Search7,113 projects · 10k OCR docs
  4. Infer3-model forecast ensemble
  5. ActWPF / .NET · 30+ daily users
  6. Dashboard12-month KPI · Power BI
  7. Analyze$41K/yr · ~90% effort cut

I built jarvis as a local voice assistant to prove the full agentic loop end-to-end: it hears you, reasons with a local or cloud model, calls real tools to act, and answers in under a second. The voice is just the demo — point that same loop at a business and the “act” step becomes forecasting finances, an employee portal, inventory, or QC on CAD models. That’s the pattern I run in production at Motz: data from two ERPs → a 3-model forecast → dashboards 30+ people use daily.

  • Acquire → reason → act → deliver
  • Multi-LLM routing — local Ollama or cloud
  • Tool-calling that takes real action
  • Same loop in production: 3-model forecast · 7,113-project search
  • $41K/yr reclaimed at Motz

jarvis itself is a local, personal build — a working proof of the loop, not a business product. The production numbers here are real: they’re my Motz platform, which runs this same acquire → reason → act pattern. Business tools shown beyond what’s shipped are illustrative of where the pattern goes.

Read the source on GitHub
Read the architecture
  • One interface sits in front of multiple model backends — a local Ollama model or a cloud LLM — so the same agent loop runs offline or online.
  • Whisper transcribes speech, the model decides on tool calls, and those tools act on the machine: the agent does things, it doesn’t just chat.
  • Replies stream into text-to-speech sentence-by-sentence, so the first audio lands in under a second instead of after the whole response.
  • Two-phase barge-in lets you interrupt mid-sentence, and the entire stack stays within a 16 GB memory budget on a Mac Mini.
  • The same loop, in production at Motz: Ajera + Vantagepoint feed a 3-model forecast that lands on Power BI dashboards 30+ people use to plan staffing.

Signature project · quantitative systems

Trader — how I found out my strategy didn’t work

I built an event-driven forex bot on a practice OANDA account, then spent most of the project doing the unglamorous part: pulling eight years of candles down from the broker, pickling them, and testing whether the strategy actually made money. It mostly didn’t. Scroll the pipeline below — collect, store, compute, backtest, report, tune — and you’ll watch the thing that matters get built: not a money printer, but an instrument that tells me the truth about a strategy. Most strategies aren’t true. This one taught me to check.

PRACTICE ACCOUNT

Showing the bands the bot watches. The scroll-through pipeline runs on a wider screen. Candles are procedurally generated; the formulas are the bot’s real ones.

  1. Collect

    The broker hands you 3,000 candles per request, so you walk the window forward in time steps until you reach the end date. Three retries per window, because the API drops requests and an eight-year gap in your data is a bug you find months later.

    • Window: 2016-01-07 → 2023-12-31
    • Per request: 3,000 candles
    • Retries: 3
    infrastructure/collect_data.py
    CANDLE_COUNT = 3000
    INCREMENTS = { 'M5': 5 * CANDLE_COUNT,
                   'H1': 60 * CANDLE_COUNT,
                   'H4': 240 * CANDLE_COUNT }
    
    while to_date < end_date:
        to_date = from_date + dt.timedelta(minutes=time_step)
        candles = fetch_candles(pair, granularity, from_date, to_date, api)
  2. Store

    Paginated fetches overlap at the seams, so the same candle arrives twice. Drop duplicates on time, sort, reset the index, freeze it to disk. Pickles rather than CSVs — the dtypes survive, and reload is instant when you are about to read the same frame four hundred times.

    • Pickles: 65 files
    • Instruments: 23
    • Timeframes: M5 · H1 · H4
    infrastructure/collect_data.py
    final_df.drop_duplicates(subset=['time'], inplace=True)
    final_df.sort_values(by='time', inplace=True)
    final_df.reset_index(drop=True, inplace=True)
    final_df.to_pickle(f"{file_prefix}{pair}_{granularity}.pkl")
  3. Compute

    Every indicator is a rolling window over the typical price — no loops, no state. Bollinger bands are a moving average plus and minus a scaled standard deviation. The band is not a prediction; it is a statement about how unusual this price is relative to the last twelve.

    • Indicators: Bollinger · ATR · Keltner · RSI · MACD
    • Signal: close crosses band, open inside
    • Gates: spread ≤ max · gain ≥ min
    technicals/indicators.py
    typical_p = (df.mid_c + df.mid_h + df.mid_l) / 3
    stddev = typical_p.rolling(window=n).std()
    df['BB_MA'] = typical_p.rolling(window=n).mean()
    df['BB_UP'] = df['BB_MA'] + (stddev * s)
    df['BB_LW'] = df['BB_MA'] - (stddev * s)
  4. Backtest

    This is where the project actually happened. I swept the parameter grid and watched almost all of it lose money. The first backtester was too slow to iterate on, so I vectorized it; when that was still too slow I ran the pairs across processes. Speed is not vanity here — it is how many hypotheses you get to kill per evening.

    • Combos swept: 32
    • Profitable: 3
    • Breakeven win rate: 41.7% @ RR 1.4
    simulation/guru_tester.py
    # guru_tester.py  →  guru_tester_fast.py  →  ema_macd_mp.py
    def is_trade(row):
        if row.DELTA >= 0 and row.DELTA_PREV < 0:
            return BUY
        elif row.DELTA < 0 and row.DELTA_PREV >= 0:
            return SELL
        return NONE
  5. Report

    Results go to Excel, one sheet per pair with an embedded line chart, because a notebook cell is where you compute a result and a spreadsheet is where you sit and stare at it until you believe it. The file ma_sim_H1.xlsx is still in the repo. It is 419 KB of me being wrong.

    • Output: ma_sim_H1.xlsx · 419 KB
    • Per pair: trades · total · mean · min · max gain
    • Notebooks: 16 in exploration/
    simulation/ma_excel.py
    chart = book.add_chart({'type': 'line'})
    chart.add_series({
        'categories': [sheetname, start_row, labels_col, end_row, labels_col],
        'values':     [sheetname, start_row, data_col,   end_row, data_col],
    })
    chart.set_title({'name': title})
  6. Tune

    What survives the backtest becomes configuration. The live bot loads it at boot, polls for newly closed candles, and sizes every position so a stop-out costs exactly $20 — whatever the pair, the pip location, or the distance to the stop. And it refuses to open a second position on a pair it is already in, because it once stacked entries all the way down.

    • Risk per trade: $20, always
    • Poll: M1 · newly closed candles
    • Guard: trade_is_open()
    bot/settings.json
    { "trade_risk": 20,
      "pairs": { "EUR_USD": { "n_ma": 12, "n_std": 2.5,
                              "maxspread": 0.0004,
                              "mingain": 0.0014,
                              "riskreward": 1.4 } } }
    
    # trade_manager.py — refuse a second position on the same pair
    ot = trade_is_open(trade_decision.pair, api)
    if ot is not None: return None
  • Collect → pickle → pandas → backtest → tune
  • 8 years of candles · 23 instruments · 3 timeframes
  • Bollinger mean-reversion · risk-sized positions
  • Backtested 32 parameter combos — 3 made money
  • Python · pandas · MongoDB · Flask · React

This runs on an OANDA practice account — no real money has ever been at risk, and I show no P&L because there is none worth showing. The candles in the simulation are procedurally generated; the thresholds, formulas, risk math, and signal logic are the bot’s real ones, ported line-for-line. The backtest result is the honest one: at a 1.4 risk-reward ratio you must win 41.7% of trades to break even, the strategy wins about exactly that, and then the spread takes it negative. That finding is the project.

Read the architecture
  • A paginated collector walks the OANDA API 3,000 candles at a time from 2016-01-07 to 2023-12-31, retrying three times per window, then dedupes on timestamp, sorts, and writes one pickle per instrument-timeframe — 65 files across 23 instruments and M5/H1/H4.
  • Indicators are pure pandas over those frames: Bollinger bands on the typical price, plus ATR, Keltner channels, RSI, and MACD — each a rolling window, no loops.
  • The backtester grew up in public: a straightforward guru_tester.py, then a vectorized guru_tester_fast.py when it got too slow to iterate on, then ema_macd_mp.py when even that needed multiprocessing across pairs.
  • Results land in Excel via xlsxwriter — one sheet per pair with an embedded line chart — because a spreadsheet is what you actually stare at when you are deciding whether a strategy is real.
  • The winning parameters become bot/settings.json, which the live bot loads at boot. It polls for newly closed M1 candles, computes bands, checks spread and minimum gain, sizes the position so a stop-out costs exactly $20, and refuses to open a second position on a pair it is already in.

Signature project · AI infrastructure

NRAP — real-time brain-activation inference, rendered live

uploading…
20,484 vertices
  • Auditory
  • Visual
  • Language
  • Motor
  • Emotion
  • Cognitive
  • Default mode
  1. UploadAudio · video · text
  2. EnqueueFastAPI → Redis
  3. Aggregate20,484 verts → ~60 ROIs
  4. RenderThree.js stipple brain

Scripted recreation of the request path, not a live inference — a real run takes 30–60s on a rented A10G. Tap “Infer” to see the backends.

Upload a song, a video, or a paragraph, and NRAP predicts how a brain would respond to it — then renders that response as a 3D particle brain that lights up in real time. Under the visual is the part I actually care about: Meta’s TRIBEv2 foundation model running on a rented GPU that costs $0 when nobody is using it, behind an interface that lets me swap the whole inference engine without the frontend noticing.

  • GPU inference at ~$0.02/clip · scales to zero
  • 3 swappable backends behind one output contract
  • Meta TRIBEv2 on an on-demand Modal A10G
  • 20,484 vertices → ~60 ROIs, aggregated at write time
  • FastAPI + Postgres + Redis queue + worker

The brain above is a scripted recreation of the request path, not a live inference: the region mapping, the band-to-region affinities and the 20,484 → ~60 aggregation are NRAP’s real code paths, but the activation values driving it are a deterministic stand-in rather than recorded model output, and nothing runs on a GPU in your browser. A real run takes 30–60 seconds on a rented A10G. NRAP itself is a working MVP, not a product: I built it to learn production ML infrastructure end-to-end. The predictions come from Meta’s TRIBEv2 research model and are not a clinical claim about any individual brain. TRIBEv2’s weights are CC-BY-NC, which is why the commercial-clean `features` backend exists alongside it.

Read the source on GitHub
Read the architecture
  • Three inference backends — a mock generator, a librosa feature-mapper, and the real Meta TRIBEv2 model — all satisfy the identical output contract: a (timesteps, 20484) float32 array. Switching between them is one environment variable and zero frontend changes.
  • TRIBEv2 runs on a rented Modal A10G that spins up on demand and scales back to zero, so idle cost is $0 and a 60-second instrumental clip costs about two cents. Routing skips the expensive extractors when the input does not need them — no video model for an audio file, no language model for instrumental music.
  • The API never calls the GPU directly. It enqueues onto Redis and a separate worker consumes the queue, so a GPU crash degrades throughput instead of taking the service down, and the two scale independently.
  • Vertex-to-region mapping is static, so the worker aggregates 20,484 raw vertices down to ~60 anatomical regions at write time. Reads stay fast; the raw arrays are still kept, gzipped, for full fidelity.
  • The frontend samples a GLB mesh into a particle field and drives it from the activation timeseries — a stipple brain that fires as the inference results stream in, without shipping a shader-heavy model to the browser.

Portfolio

Selected work

A through-line of real products — most of them thread AI into something people actually use.

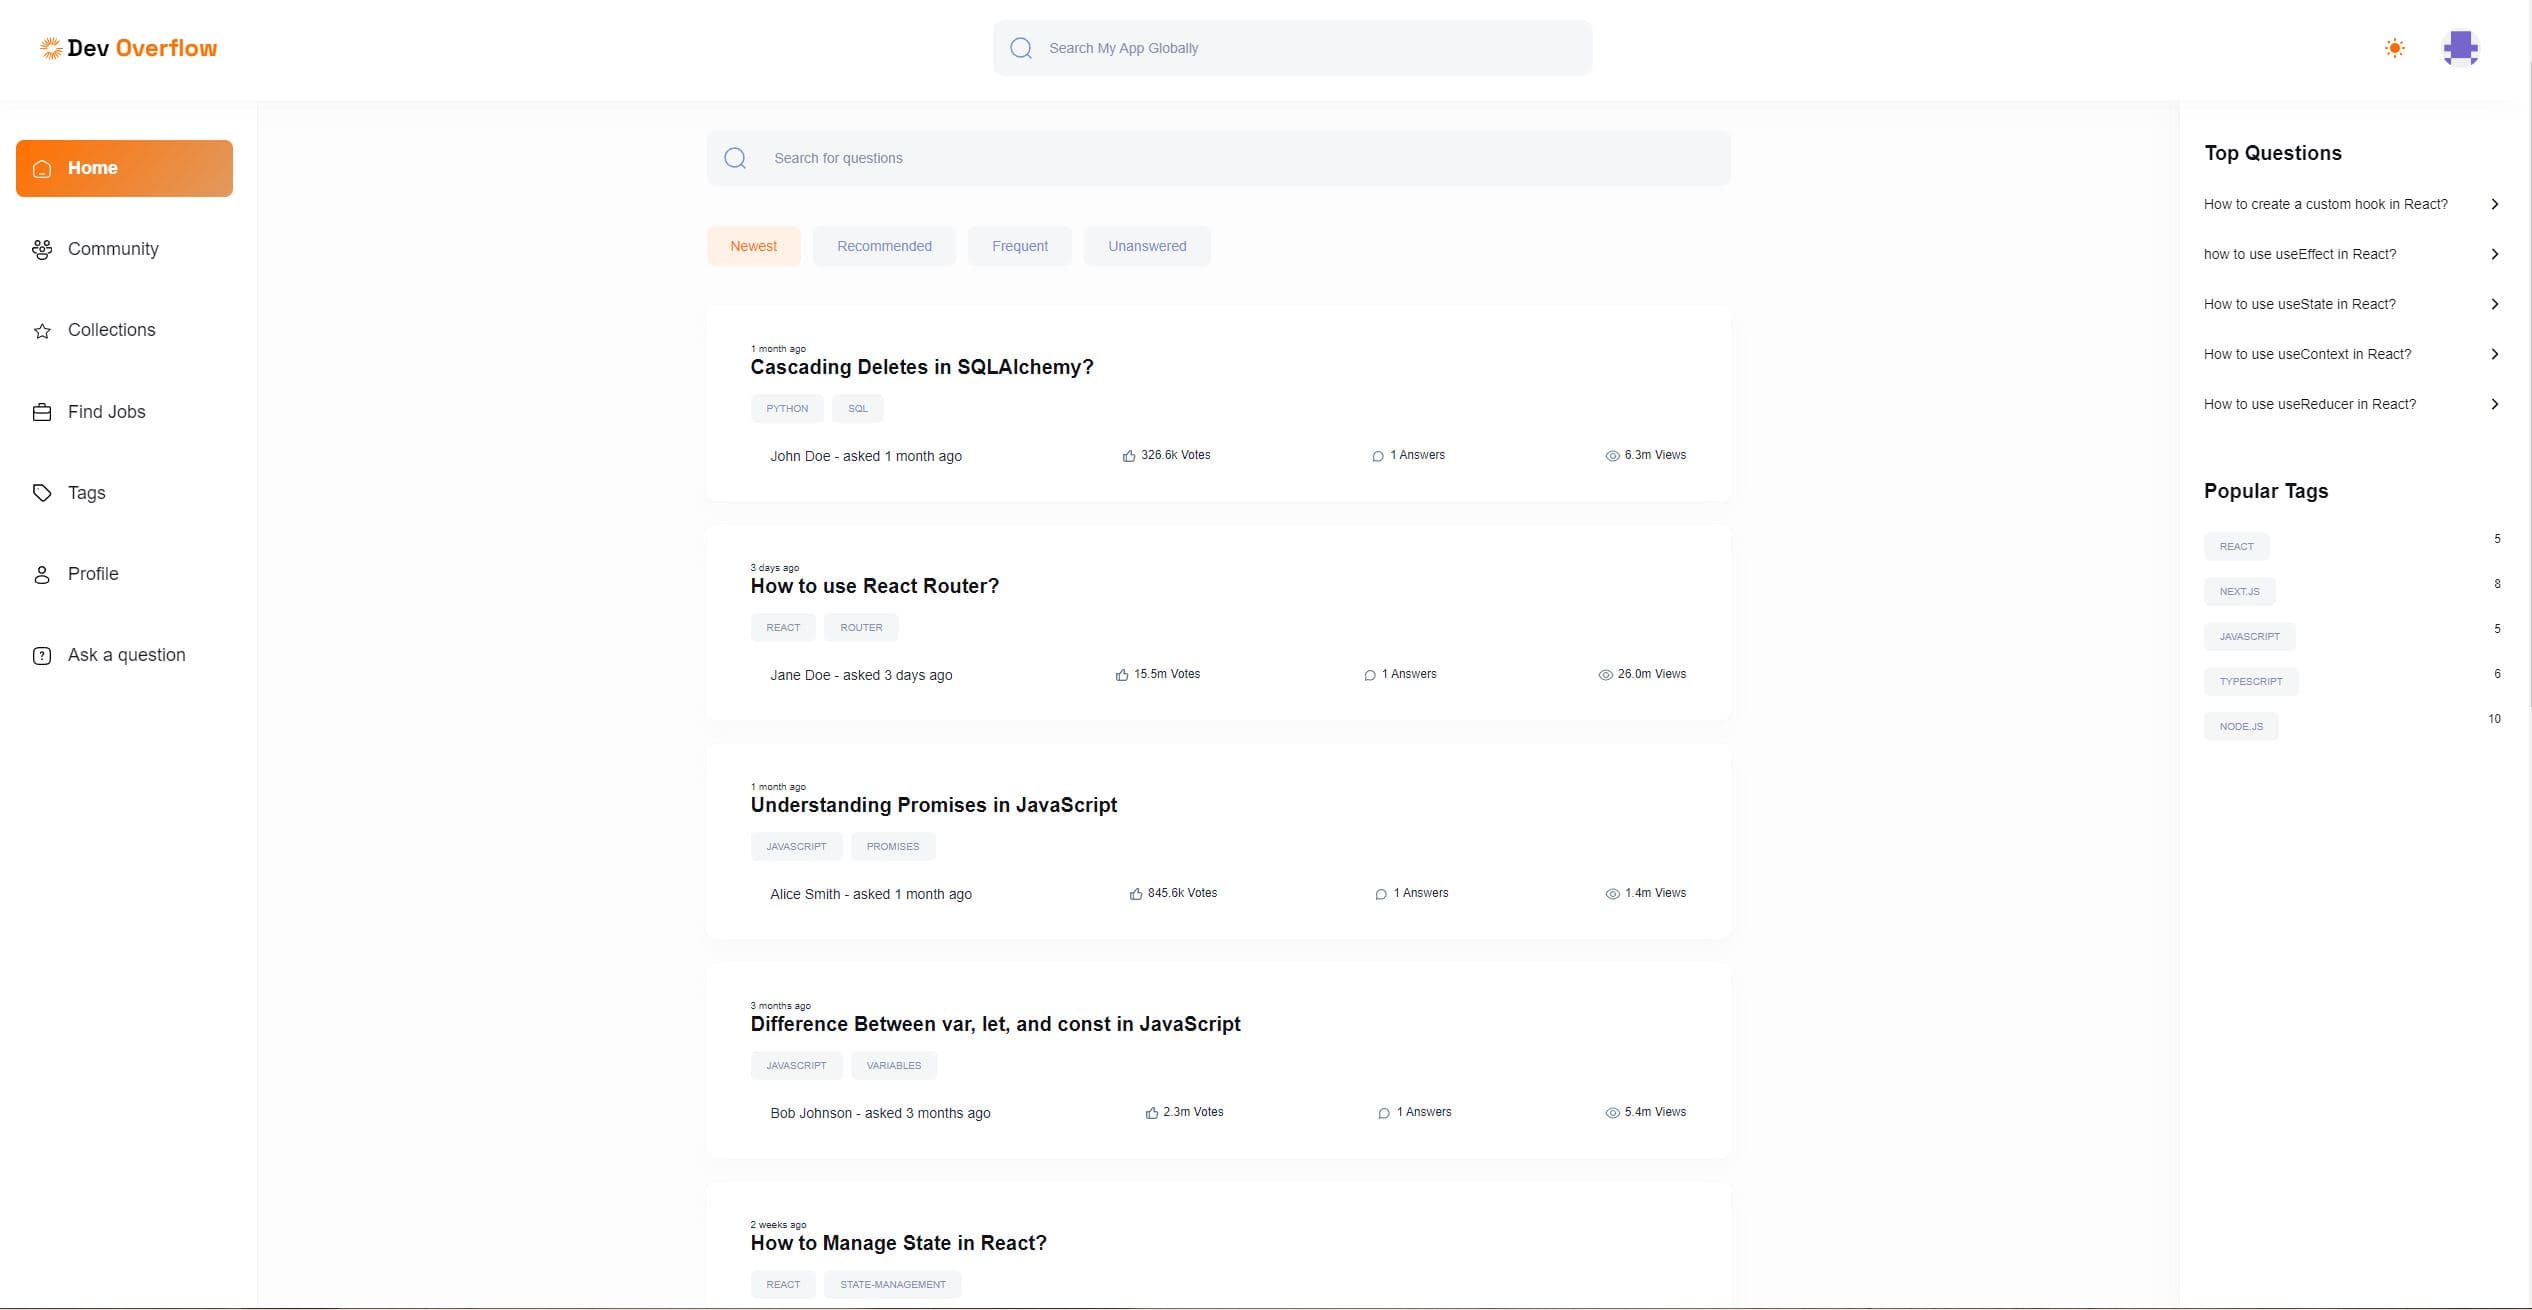
DevOverflow — live Q&A with AI answersLive demo AI-integrated

DevOverflow — live Q&A with AI answers

A Stack-Overflow-style Q&A platform: post a question and an LLM auto-drafts an answer alongside community responses.

What's hard: Genuinely deployed and clickable — real auth, Next.js, live on Vercel.

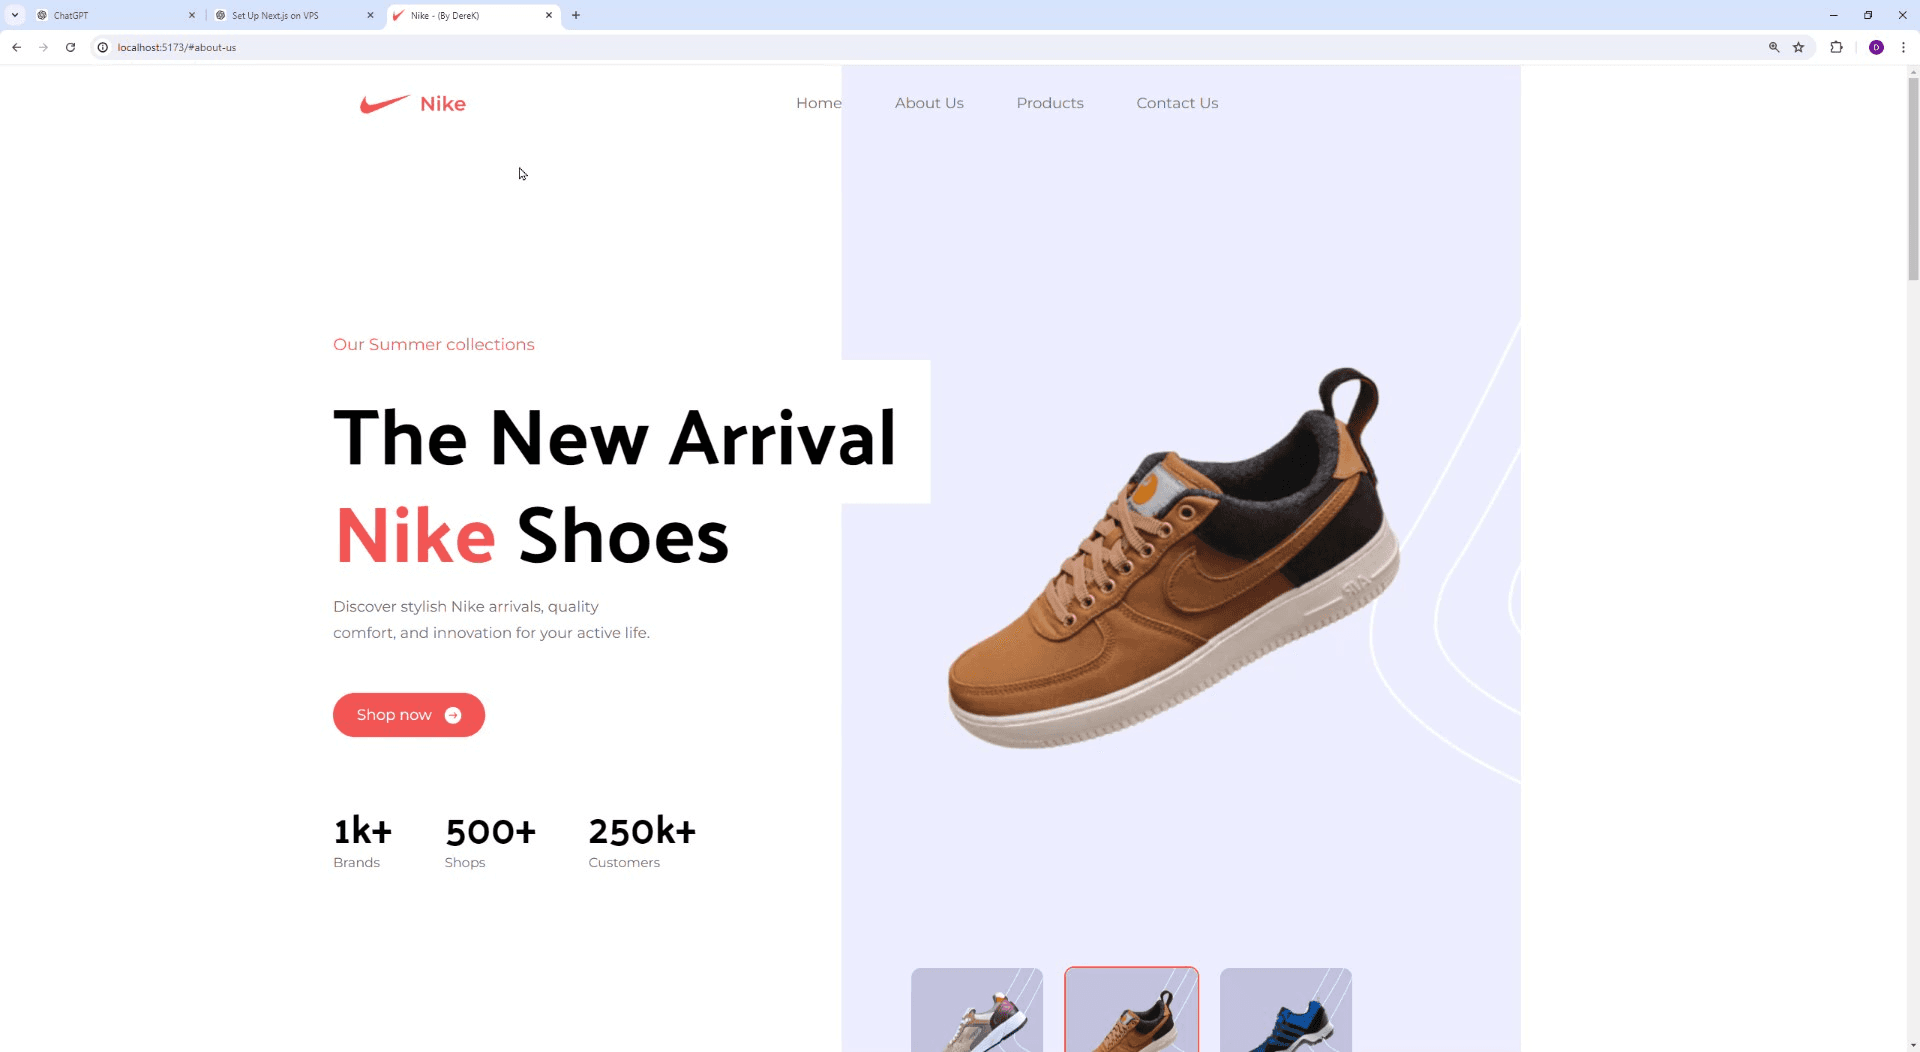
Nike Landing PageLive demo

Nike Landing Page

A focused, responsive marketing page built as a front-end craft sample.

What's hard: Pure responsive-UI craft — framed as exactly that, nothing more.

ThinkWell / LunaTeam project · my piece: Luna AI-integrated

ThinkWell / Luna

Cross-platform iOS + Android wellness app with peer-to-peer messaging and activity tracking. I built Luna — a ChatGPT-powered companion — solo.

What's hard: Luna threads OpenAI through a C#/Xamarin MVVM app; the Google Places finder, P2P messaging, and cross-platform build are the parts that genuinely shipped.

  • csharp
  • xamarin
  • android-color
  • apple-tile
  • sqlite-icon
Private / no public demo
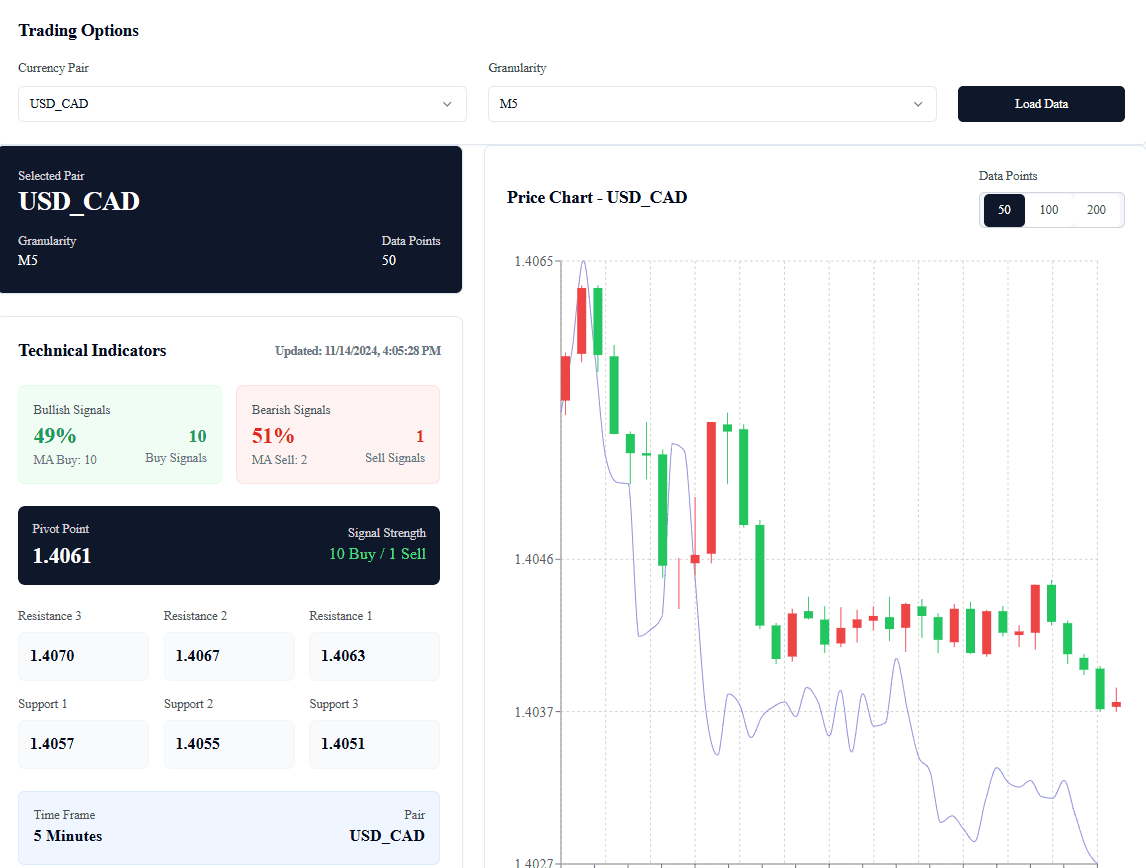
Trader — algorithmic OANDA botPractice project

Trader — algorithmic OANDA bot

Event-driven forex bot trading a practice OANDA account with Bollinger-band mean-reversion, risk-based position sizing, and a React dashboard.

What's hard: Risk-sized positions across an ~80-pair engine; the real stack is Python / pandas / OANDA, not the old tag-soup.

  • python-icon
  • re
  • git
Private / no public demo

Get in touch

Let's talk

Looking for a full-stack engineer who ships and measurably saves money? I'm open to work.